Dashboard
The dashboard provides you with an overall view of activity metrics on the platform.
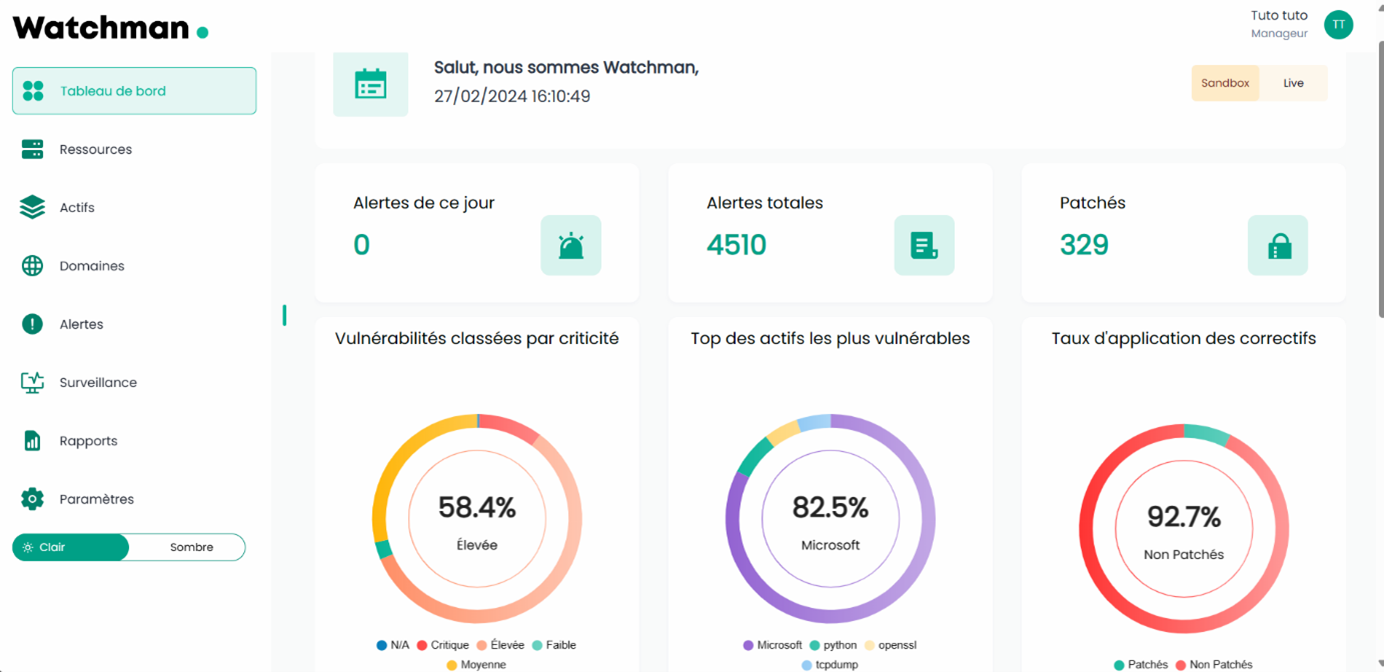
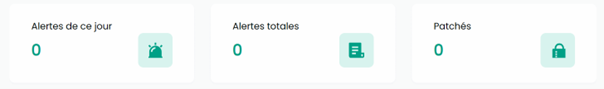
1. Statistics on Received Alerts
This section displays:
- The number of alerts received today
- The total number of alerts received
- The number of alerts fixed
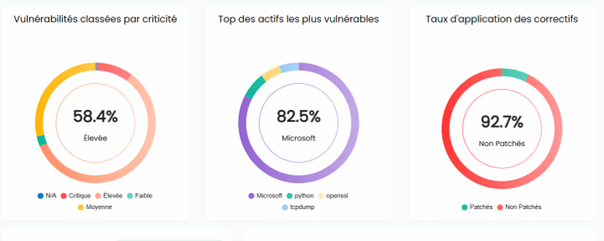
2. Graphs on Vulnerabilities by Severity Level
These visualizations allow you to analyze:
- Vulnerabilities by severity level
- The most vulnerable assets
- The patch application rate
3. Integrations
Watchman can be integrated with collaboration tools to receive your alerts directly on those platforms.
Click the “Add Integration” button:

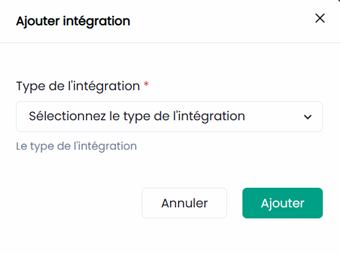
A form appears, offering you three integration options:
- Slack
- Microsoft Teams
- Discord
Select the desired platform. You will be redirected to the related application to finalize the connection with Watchman.
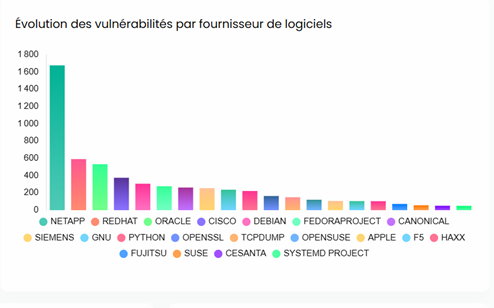
4. Graph: Evolution of Vulnerabilities by Vendor
This section shows a graph presenting the evolution of vulnerabilities categorized by software vendors.